Tuesday, October 31, 2006

Vacant Housing Inventory For Sale on the Rise

In an interesting development, UBS reports that in the third quarter vacant housing units for sale have surged to new highs, at over 1.5% of total housing stock (the 36 year low was approximately 0.5% in 1970). Vacant housing for sale plus new single-family homes for sale under construction as a percentage of total housing stock has increased to nearly 1.8%. The prior peaks in 1984 and 1988 were at 1.3%. The 30-year low was in 1977 at just under 0.9%. Current dollar as well as real home prices are now falling. The rental equivalent price index has trended up lately, reflecting the move of former homeowners back to rental markets. Yet the rental vacancy rate is still a relatively high 9.9% nationally.

Strategy Update: The Dynamic High Yield Strategy is up over 16% year-to-date versus the Lehman 
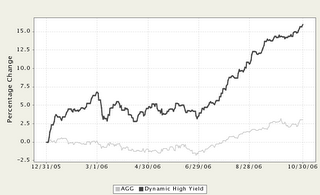
Aggregate Bond index of about 3% (see chart). The strategy's main focus is to profit from movements in the discount to NAV of closed-end bond funds. We continue to take profits in this sector and move to US treasury ETFs, now currently at about 50% of the strategy. For more information on strategies management, visit our website.

Monday, October 30, 2006

New Highs Rolling Over

Net new highs have rolled over recently as can be seen on this chart from Don Hays. This trend change is even more evident on the Nasdaq index. With the end of the quarter tomorrow, followed by elections next week we think this makes the case for some caution here.

Strategy Update: The Dynamic Beta Strategy has returned 22.0% since the bottom in June, well ahead of its balanced benchmark of 9.2% and the S&P 500 Index return of 13.3%. Today, we reduced equity exposure to 24% and may reduce further if the individual stock holdings show signs of tiring. Several of the remaining positions are gold related and have recently shown positive performance and inverse correlation to the equity market.

Friday, October 27, 2006

GDP Comment

Ten-year interest rates have declined 15 basis points, from 4.82% to 4.67%, on indications of weaker economic growth. This was capped off by the third quarter GDP report of 1.6% annualized growth. UBS comments that, "if anything, the details of Real GDP looked even weaker than 1.6%. The 1.6% figure was despite a reported 27.5% rate of increase in motor vehicles production . . . Excluding motor vehicles production, real GDP was up at just a 0.9% annual rate in Q3 after 3.0% in Q2."

The 4.67% ten-year rate is near recent lows of 4.55% in late-September. We think interest rates, stocks and the economy transition to a condition of "noise" versus trends for the balance of the year. Expect reports to continue to present a mixed picture.

Strategy Update: Below are charts of two strategies that have done well recently, Dynamic Beta and Focused Analyst Growth. In each case lately, our managers have elected to take partial profits on positions and attempt to moderate the bets. Analyst Growth powered through this recent period with high earnings growth companies. In contrast, Dynamic Beta suffered in late August and early September initially through holding too much cash, then later through too early of a bet on resource and materials stocks. The latter bet has paid off in recent weeks.

Wednesday, October 25, 2006

Confusion among the experts

Richard Russell, the long-time writer of the Dow Theory Letters recently commented on the large divergence of opinion regarding the current state of the markets. He mentions several: "David Fuller writes, 'we have often said that Wall Street is in a secular bear market, which we define as a generational long period of P/E ratio contraction and rising dividend yields. The path that a bear market follows is dictated by the availability of liquidity. A Japanese style deflation has been averted because the Greenspan Fed eased aggressively and allowed the monetary base to expand. Barring a major central bank monetary policy blunder we can expect Wall Street's uptrend to continue. James Paulsen, a successful investment strategist is basically bullish although he believes somewhere ahead the dollar must fall . . . Noriel Roubini almost guarantees that the US is headed for a major recession that will hit in 2007 . . . Martin Barnes of the Bank Credit Analyst believes that 'the US economy remains on track for a housing and consumer-led mid-cycle slowdown' . . . but 'the grinding equity bull market should continue. Valuations are decent and market multiples should expand when it is clear that the Fed has finished tightening' . . . [yet] fund manager John Hussman writes: 'The current Market Climate in stocks is characterized by unfavorable valuations, but modestly favorable market action. Valuations are sufficiently high that we can already conclude that total returns on the S&P 500 over the coming 5-7 years will probably fall short of Treasury bill yields. The current bull market has already lasted beyond the historical norm, and though the S&P 500's percentage gains of the past several years haven't been spectacular from a historical perspective, this has been among the longest periods the market has ever gone without a 10% correction' . . . Lowry's thinks that what we're seeing now is an extension of the bull market that began at the 2002 lows."

As for Russell, he asks, "where's the decline associated with the 'six bad months' of May to October?" He also notes the market's current "remarkable complacency . . . Volatility, now below 11, is near a record low, this in the face of a failing war, huge deficits, and the possibility of a housing slide."

We believe the stock market is both overbought and overvalued yet find ourselves mostly content to earn profits as long as Hussman's "favorable market action" continues.

Strategy Comment: Month-to-date we have 7 strategies up 5%-10% (the Focused Analyst Growth strategy up 10% MTD and over 21% year-to-date). We find this to be incredible, particularly since the market never had the usual September/October correction. Our increasingly plausible rationale for this is the greater influence on the markets of trend following hedge funds. This makes it important to not be contrarian too early nor too anxious to exit profitable positions. It also increases the importance of analyzing inflection points.

Friday, October 20, 2006

Silly Season for Budget Deficit

In our view, election time is always the silly season for the Federal budget deficit. This is because politicians like to rant and rave about the deficit. The fact is, it doesn't and never did have much impact one way or the other on interest rates or stock returns.

We've always thought the concern was misplaced, anyway. Shouldn't we be more focused on overall spending trends? Would you rather have a federal government that spends 18% of GDP but only confiscates 17% of GDP in receipts or a government that spends 22% of GDP but balances the budget? I'll take the former. In reality, congressman would prefer continual work on narrowing the deficit but only through increases in revenues. This provides more opportunity to run deficits and ramp up spending. It appears to make no difference if your congressman is a Republican or Democrat, the result is the same. Why are the Republicans in so much trouble this year? They were elected in 1994 on a platform of limited government. Spending is up 49% in the last 5 years. Voters figure that if Congress has no interest in spending constraint they might as well vote for the real champions of pork - Democrats.

How does this play into investments over the short-term? We think that as investors come to believe Congress may swing to the Democrats, that stocks will take a breather. Government spending won't be much different.

Tuesday, October 17, 2006

Help Wanted Index

The Help Wanted Index has plunged since late winter. This appears to be solid evidence of slowing job growth, as well as slowing overall economic growth.

An additional sign of slowdown has begun to show up in state sales tax collections. The Liscio Report states that "just 37% of the states in our Survey met their forecasted sales tax collections, down from 51% in August," with the majority reporting, "wide misses, the worst of these coming in 2-8% below where they thought they would be."

Monday, October 16, 2006

US Dollar Confounding the Experts

The stronger dollar has confounded the experts since the 2006 bottom in mid-May and the more recent bottom in August. Several items usually help predict the direction of the US Dollar. First, loose fiscal policy and tight monetary policy have often resulted in a stronger dollar. This was the case over the last year or so but a recent surge in tax receipts that results in a narrowing of the budget deficit could signal changing dynamics. Second, high consumer spending usually leads to lower savings rates and a lower dollar. Recent indications are that the consumer is beginning to back off slightly on spending and save more, again producing somewhat of a mixed message. Our forecast is for the US Dollar Index to continue to muddle along in a trading range of 84 to 88 for the next several months.

Strategy Update: We had a small long dollar position in the Dynamic Fx Strategy that we reversed on the close today. We think the dollar reverses within the trading range but have a weak enough conviction that our position size is small. The majority of the portfolio continues to be invested in intermediate treasuries. Dynamic Fx has outperformed the Lehman Aggregate Bond Index benchmark by 2.75 percentage points year-to-date. Visit our website for information on Strategies investing.

Friday, October 13, 2006

Nasdaq Strength

One of the more reliable signals we have used for the market is the relative strength of the Nasdaq versus the NYSE Composite, seen below. You can see the relative strength bottomed in the first week of August and has risen steadily since. The market as a whole is severely overbought at these levels.

Thursday, October 12, 2006

Interesting Times at OPEC

OPEC produces about a third of the oil used worldwide and obviously enjoyed the higher prices that oil fetched earlier in the summer. Prices are now down over $20 from July highs (see the INO chart below).


The problem for OPEC is to decide who will help with production cuts. OPEC President Edmund Daukoru (aka The Little Red Hen) said this week that it was agreed they would cut production by one million barrels a day. It is difficult finding anyone who to admit they will contribute to the drop.

In prior times of declining prices, Saudi Arabia, by far the largest producer, at about 9.1 million barrels a day, has taken the brunt of the cut. In the late 80's it nearly bankrupted itself trying to put a floor on the market. We believe it has little interest this time around to be the sole swing producer simply because it has no interest in causing pain for itself while Iran remains unscathed. While they won't say it too loudly, the Saudi's might enjoy seeing Iran squirm a bit. In any event, we think the plunge in prices causes OPEC to finally grapple with this over the next couple of months. With the decline slowing in the last couple of weeks, this seems to be occurring.

Strategy Update: several strategies are now overweight economically cyclical sectors such as energy, basic materials and commodities. Reason: oversold technically, favorable seasonal factors, low P/E multiples and a belief that we are still in the middle innings of a commodity bull market.

Monday, October 09, 2006

Mortgage Problems

We think it interesting to note that several financial firms have taken hits to earnings recently as mortgages they underwrote have come back to haunt them. The issue: mortgages are often booked, then sold to mortgage consolidators. If problems surface on repayment of the loan, the consolidators may come back to the originator and claim that there was inadequate due diligence or weak underwriting standards. They can demand compensation or they may push the non-performing mortgage back to the originator. This could be a sleeper issue for banks and other financial institutions if the real estate down cycle lasts much longer. Many regional bank's stocks are near all-time highs yet a high proportion of recent revenue increases were from mortgage originations and related interest income.

Friday, October 06, 2006

Inflation, Hourly Earnings and Housing

Average hourly earnings rose 0.2% in September - a level hardly sufficient to spur new consumer spending. The unemployment rate also dropped to 4.6% from 4.7%. Recent reports also show a leveling off of inflation with the CPI growing only 0.2% in August, down from 0.4% in July. While all these reports are highly subject to revision, we think it means there is little chance of the Federal Reserve increasing short-term interest rates in the next few months.

Further evidence of benign inflation was the report of a drop in existing home prices of 1.7% over the last year, the first decline in eleven years. Anecdotally, we think the pain is greater than the indexes indicate. One analyst pointed out that if priced right, the homes in the best condition and the best locations will often sell close to asking price even in tough broad market environments. The homes in less desirable locations and poorer condition just don't sell - and therefore, don't contribute to the index. Past recoveries in housing covered up some of this behind the scenes pain. This time the decline may be longer and more widespread. Yesterday's Wall Street Journal reports on a Moody's survey that projects price declines for many cities, with some not expected to hit bottom until the second quarter of 2009 (Las Vegas, Fresno, Bakersfield, Saginaw, Portland OR).

Thursday, October 05, 2006

The Economy and Interest Rates

There continues to be significant discussion regarding the impact of slower auto sales and a housing market in near recession. Namely, can consumer spending hold up in the face of these headwinds. Recent oil price declines and to a lesser extent, natural gas price declines have helped consumer sentiment. However, we suspect this will not be enough to prevent the economy from slipping lower over the next several quarters. One confirmation of this was the recent dramatic reported drop in the business price index falling from 72.4 to 56.7. The Fed does not seem concerned about any pain currently being felt by house flippers or speculators. Don't look for short rates to drop over the next several months.


The above chart shows ten-year treasury rates over the past three years. In this context, the recent rally from 5.25% to 4.60% in yield has been typical. We think yields continue to trend lower but the easy money has been made here.

Strategy Update: We swapped another 10% out of high yield closed-end funds in the Dynamic High Yield Strategy. That brings us up to 42% treasuries. We continue to think this makes sense in light of not only the recent drop in interest rates but also the drop in credit spreads, as well. YTD performance through 9/30 is 14.22%, providing some room for profit-taking.

We moved to a fully invested position in the Dynamic Commodity Strategy adding a small position in silver and adding to a general commodity ETF. We think we are at the tail end of mutual fund realignment into finance and tech, etc. and away from commodity related stocks. As such, it looks like a solid contrarian bet for the next quarter or two. We also went to a barbell position in the Dynamic Global Macro Strategy, utilizing commodity and international equity exposure. Our international positions are focused on Asia, small-cap Japan, emerging markets and a little Latin America. In general, these have some correlation to rising commodity prices, but also think some of the U.S. market's recent strength will spill over into international markets.

Monday, October 02, 2006

Midterm Elections

Since 1950, the stock market has had an average gain of 18.6% in the 12-month periods following mid-term elections. In four of the last six midterm votes the one-year gain following exceeded the average: 24.9% in 1998, 21.7% in 1994, 25.7% in 1990 and 23.5% in 1982. The other two were also positive: 16.7% in 2002 and 6.2% in 1986.

Most of these years saw a fairly strong decline in the market prior to the election, something we haven't seen yet. They also began at a much lower P/E than today's. To see the 18.6% average one-year gain coming out of this year's election would require a lower market over the next five weeks along with dramatically lower interest rates in 2007. We think the Fed will be lowing rates next year but doubt it will be enough to produce an above-average gain in the market, especially in light of the record high profit margins we are seeing this year and a clearly slowing economy.

It is interesting to note that the poorest performing post-election year was 1986 - another year with a second term Republican president experiencing significantly lower approval ratings than seen earlier in the presidency.