Thursday, November 30, 2006

FRODOR

One of Ed Yardeni's great contributions to financial discussions has been his analysis and use of Foreign Official Dollar Reserves (FRODOR). This is defined as US marketable securities held in custody for foreign official and international accounts at the Fed. We've always been impressed with FRODOR's forecasting ability. Visit here to view the correlation between FRODOR and various indexes.

A couple of comments: FRODOR momentum has been declining since 2004. After reaching a cyclical peak of near 35% it has backed off to under 15%. In the past, this decline in momentum has generally coincided with a decline in the US Federal Deficit and an easing in the rate of growth in the US Merchandise Trade Deficit. It has frequently preceded declines in the CRB Raw Industrials Spot Price Index, the CRB Metals Spot Price Index and crude oil demand. With regard to equities, a drop in the FRODOR rate of change typically precedes a drop in S&P 500 forward earnings momentum. Finally, FRODOR seems to have a fairly reliable inverse correlation to the Trade weighted dollar.

Our take: after backing off in 2004 and 2005 from a decade long high, the annual rate of change for FRODOR has churned sideways for a year at a still relatively high level. We think there is a high probability of the decline reasserting itself until it reaches flat year-over-year growth. If so, this would suggest a strong dollar, weak earnings, falling commodity prices and crude oil demand, and falling trade and budget deficits. For more commentary from Yardeni, see this older analysis.

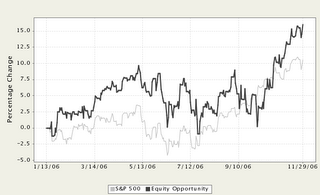
Strategy Update: Equity Opportunity Strategy is a value-based portfolio that is currently up 19.7% YTD through 11/29. The best performers in the Strategy since purchase have been ECA, PRAA, THE, TRX and USG. We continue to think a value strategy makes sense in this environment of private equity capital looking for deals. As always, past performance is not indicative of future results.

Wednesday, November 29, 2006

Market Undervalued?

The CXO Advisory Group LLC produces an interesting value analysis of the markets with their Real Earnings Yield Model and their Reversion to Value Model. Currently, the models indicate the S&P 500 is 8-26% undervalued. The models appear to have reasonably strong predictive value over longer periods of time.

Trucking Volume

An interesting post from the MarketBeat Blog regarding recent trucking volumes. They mention "volume fell 1.8% in October, putting the index at its lowest level since the end of the first quarter . . . The news prompted David Rosenberg, chief North American economist at Merrill Lynch, to note that it is extremely rare to have truck tonnage go down in October ahead of the holiday shopping season — declines of the likes we saw last month took place in 1981, 1982, 2001 and 2002, and these proved to be disappointing sales periods.”

Tuesday, November 28, 2006

Money Supply and Equities

Dr. Marc Faber comments at AME Info that "the notion among investors has again arisen that the Fed will soon cut interest rates and support the economy and asset markets with monetary policy measures. I believe that, sooner or later, this scenario is very likely, but instead of boosting the real economy and asset prices in the US, it will lift precious metals, commodities and foreign assets further." This is a provocative call - why would this be the case?

Faber continues: "In the monetary philosophy of Mr. Greenspan and Mr. Bernanke, a bubble is never a problem. However, if the bubble bursts, a problem might arise - as was the case in Japan in the 1990s and in the US in 1929/32. So, the central bank must immediately provide enough liquidity to the system in order to prevent the bursting of the bubble having a negative impact on the economy!"

"In the long run [this is] a suicidal monetary policy because it leads to one asset bubble after another. So, after the NASDAQ in 2000 and housing in 2005/2006, where is the next big bubble going to occur? In my opinion, two asset classes stand out as asset bubble candidates: grains and Asian assets. Wheat and corn have led the grain and agricultural commodities price advance over the last two months. But now, it is very likely that the entire sector including especially soybeans, sugar, coffee, and cattle, will follow. Other 'bubble candidates', are Asian currencies, stocks, and real estate prices."

Given these factors and the belief that the US equity market is overbought, investors are complacent, bullish sentiment is high and volatility is low, Faber leans to a short the S&P position rather than long.

Strategy Update: Focused Analyst Growth started the quarter weak but since then has exceeded the S&P 500 by over 10 percentage points quarter-to-date even though it has held 10% cash for the last month. Performance year-to-date is a positive 27.7%. The best performing stocks held in the strategy are LSI Logic and Allegheny Technologies, although we would not be buyers of these two at today's prices. On Wednesday, our manager moves to a 20% cash position. Visit our website for more information on how we can bring you investment solutions that work.

Petrodollars and the Urge to Merge

We think one of the reasons we were wrong (early?) on expecting a correction in the equity market is the huge interest in doing deals. According to Ritholtz Research & Analytics the total value of 2006 deals announced through November 17 "had reached a record $3.368 trillion. . . the surge is being driven by companies which, after years of big stock buybacks and dividend increases, still have large amounts of cash. The flood of money into private equity funds also needs to be put to work." An added factor is that of corporations and countries trying to secure sources of supply of raw materials and energy through the equity markets.

Another spin on this comes from Peter Thiel in the 11/27 issue of Barron's. His contention is "that volatility has been suppressed across all global markets as a result of the flow of petrodollars into the world economy. Basically, there was a $1 trillion dollar tax increase on oil, and while that's bad for consumers, its actually been very good for financial markets because the money has been reinvested in financial markets: gold, real estate, tech stocks, emerging markets and equities."

We think this increases the attractiveness of companies trading at cheap ratios of Enterprise Value to EBITDA. Prior to the announced merger, Phelps Dodge Corp was trading under 5x. This could result in value continuing to play better than growth in the equity market.

Strategy Update: The Dynamic Fx Plus Strategy's goal has been to add 2-4% each year over the Lehman Aggregate Bond Index (AGG). As can be seen here it has outperformed the index by nearly 4% year-to-date. So far so good. We have decided to slightly broaden the Strategy's security selection universe to include some new currency-related exchange-traded funds (ETFs), as well as various existing foreign closed-end bond funds. These will provide the Strategy with improved income and appreciation potential, as well as enhanced FX flexibility, as its name implies. Visit our website for more information on strategies investing.

Wednesday, November 22, 2006

Equity Return Outlook and Cash As Trash

A recent research publication from Crestmont Research, reprinted in Mauldin's E-Letter (see 11/20/06 Outside the Box archive), a detailed analysis of future stock returns provides a good baseline for understanding what challenges investors face in overcoming a long-term lackluster market.

Assuming heady assumptions on ending earnings per share ($116) and P/E ratios (23) they project annual returns of 6.9% through 2016 (from a 1375 base in the S&P 500 Index versus today's close of 1406). This does not include dividends, so figure 8.9% with dividends. If the P/E ratio fades to 15 times in 2016, the average return is 2.4%. They also make a case for earnings of $81 in 2016 which means an annual return of 3.1% at 23x PE and -1.2% at 15x PE. Of course, if PE's revert to levels seen in prior bear markets of 10x, the annual return could be between -5.2% and -1.7%.

Cash isn't Trash: As they point out in the article, about the only way to exceed these returns is to focus on absolute return strategies. Some time ago we realized a couple of things about absolute return strategies:

First, it only takes a compounded return of 1.17% per month to reach an annual return of 15%. If you assume that, on average, half your portfolio was invested in cash equivalent earning 4.5% with the rest of the portfolio invested in stocks paying dividends of 1.5%, your average return from income would 3.0%, or 0.25% compounded monthly.

Second, subtracting 0.25% from the goal of 1.17% leaves 0.92% per month needed from appreciation to make the 15% annual return. There are several ways to get to a 0.92% monthly return: One could put 10% of the portfolio in an investment that rises 9.2% over the course of a month. Or maybe put 50% in a few securities that experience an average appreciation of 1.84%. Or maybe for a short period of time place the entire portfolio in securities that appreciate an average of 0.92%. This is the equivalent of riding a stock from $27 to 27.25!

What can we learn from this? Cash isn't trash if you invest in the right securities when opportunities are present! Even with a large-cap index like the S&P 500 there are multiple opportunities to make 5-15% every year. So why don't more investors invest this way? We can think of several reasons: First, the advisory business tells investors to stick with the mutual funds they're currently invested in (if they don't own the funds, the funds can't earn the management fee). Second, they chase fund performance; a "cash isn't trash" investment philosophy usually requires a bit of contrarian resolve (going against the herd) that sometimes means you are on the sidelines watching as markets continue to rise. Third, they don't understand the impact of negative returns and the importance of avoiding them: let's say you wish to average 15% per year over a 3-year period for a total compounded return of 52%. If you lose 15% in the initial year it will require nearly 34% in each of the next 2 years to capture the average return of 15% - not an easy task. Finally, they just don't have the time, experience or interest in pursuing this approach. A "swing only at fat pitches" philosophy requires some on-going decision-making. Take a look at some of our strategies that utilize some of these philosophies.

Monday, November 20, 2006

Housing Sentiment and Inventories

Housing continues to weigh on the economy. Gary Shilling's recent article (see archive for 11/17) on housing that is reprinted in John Maldin's Weekly E-Letter is an interesting read.

Of the many charts in the article, we think these two are the most interesting. The first shows how real consumer spending follows homebuilders' sentiment but typically with a small lag. The potential for a meaningful slowdown in consumer spending is real. The second chart shows that inventories of existing homes for sale have a long ways to go up before they approach earlier peaks. Shilling's conclusion is that the housing price decline will exceed 25% and hit bottom no sooner than the first quarter of 2008. That should make for an interesting political campaign, particularly if Iraq is off the radar screen.


Strategy Update: The Select REIT Strategy benefited from its ownership of Equity Office Properties Trust (EOP), which is up substantially (over 13% from month-end) on a takeover announcement. Dynamic Beta Strategy is currently at a minimal equity exposure after experiencing a rise of over 23% from the June low in the equity market.

Friday, November 17, 2006

International Equity Overbought

BCA Research reports that "Global equities are due for a breather".

According to BCA, they have "gained 16% since mid-June, and are now well above their May high. Stocks have benefited from a stream of positive economic surprises, including the sharp fall in oil prices and bond yields, among other things. It will be increasingly difficult to sustain this positive news flow in the short term. Moreover, this latest surge in stock prices is already comparable to the past three rally phases during the bull run that began in 2003, indicating that stocks are more vulnerable to any “bad” news. Bottom line: although market fundamentals on a 6-12 month horizon are still favorable, stocks look stretched from a short-term perspective."

Saturday, November 11, 2006

Median Net Worth

From Freemoney Finance, we note the median net worth as well as the net worth for the top 25% and top 10% of people in the U.S. for various age categories:

Age 20-29 Median Net Worth: $7,900 Top 25%: $36,000 Top 10%: $119,300
Age 30-39 Median Net Worth: $44,200 Top 25%: $128,100 Top 10%: $317,800
Age 40-49 Median Net Worth: $117,800 Top 25%: $338,100 Top 10%: $719,800
Age 50-59 Median Net Worth: $182,300 Top 25%: $563,800 Top 10%: $1,187,600
Age 60-69 Median Net Worth: $209,200 Top 25%: $647,200 Top 10%: $1,429,500
Source: Federal Reserve Board's 2004 Survey of Consumer Finances

This doesn't say much for people's commitment to saving. Let's say you started saving at age 20 and you put your savings into a small-cap index fund that returned 11% per year (this has been very achievable). To have the Median Age 59 Net Worth of $182,300 would require a monthly savings of a little over $23, or a dollar and a dime a day for each work day. You get more than that in change each day. A related rule-of-thumb is that saving $100 each month in a small-cap (preferably value) fund over a 40 year career is usually enough to put you close to a million dollars.

Thursday, November 09, 2006

October Strategies Performance

Strategies performance for October and year-to-date is now available. Returns significantly beat the S&P 500 for most of the equity-based strategies, paced by Focused Analyst Growth up 10.21% for the month and 22.07% year-to-date. On the fixed-income side, strategies utilizing closed-end funds or Fx overlays performed best, with Dynamic High Yield leading the way up 16.42% year-to-date. As always, see the disclaimers on past performance. Visit our website for more information on investing with us.

Tuesday, November 07, 2006

Sub-Prime Mortgages Start to Bite

The November 13 issue of Forbes takes a look at the trends in sub-prime mortgages. They note that "lenders did a lively business issuing mortgages in amounts perilously close to the full value of the home being bought or refinanced," and now Christopher Cagan of First American Real Estate Solutions calculates that 29% "of homeowners who closed mortgages in the first nine months of 2005 were sitting, as of February, on zero or negative equity. . . he also calculated that a further decline of 5% in home prices would jack that fraction up to 38%."

Strategy Update: Little change in strategies recently. Fixed-income (bond) strategies are fairly neutral duration relative to benchmark. Equity strategies generally have some cash cushion due to the overbought technical position of the market.

Monday, November 06, 2006

Employment Trends

Last week the unemployment rate unexpectedly dropped to 4.4% from 4.6%. Many economists were expecting a rise to 4.7%. Overall employment data has also been strong in recent months (primarily due to strong upward revisions to August and September data). The Fed is unlikely to begin dropping interest rates until they see job growth slow and the unemployment rate rise.

In our opinion, the 4.4% unemployment rate is probably wrong and we'll see reversal of that begin next month. Evidence for that includes very weak housing-related employment and various diffusion indexes that show a slowing in employment. Also, the initial jobless claims jumped in the latest week from 309,000 to 327,000. These patterns should eventually be reflected in the unemployment rate. Housing related employment usually follows housing starts with a lag. Starts rolled over in April but housing units under construction only rolled over in August. This suggests housing employment is poised to slow significantly in the next several months.