Thursday, December 28, 2006

Inflation Notes

Put us on the side expecting inflation to moderate over the next several quarters. We were interested to read a few comments from Dr. Donald Ratajczak, Morgan Keegan's Consulting Economist:

"I guess we all could get upset by that gargantuan price gain for finished goods and for the core in the PPI. Frankly, I prefer to look at the changes from a year ago. Thus, the 2% monthly gain in finished goods is only 0.9% for the year. That 1.3% surge in the core is only 1.8% over the year. Of course, we should not talk so lightly about producer prices, but who seriously believes that SUV prices plunged 9.7% last month only to surge 13.7% this month. I even doubt that they are up the 0.7% from the previous year that the tables indicate. Certainly, a 2.2% gain in passenger car prices is suspicious when it follows a 2.3% drop the previous month. I certainly am not going to get upset by the surge in vehicle prices, which I doubt you will discover at the dealer's."

"Even with a near doubling of natural gas prices for the month (reflecting the unwinding of large hedge bets by one trader), they are down 35% from the previous year. . . Metal prices have reversed [gains] in recent weeks. Indeed, while my leading inflation indicators increased modestly in November, they already appear to be falling in December."

We would suggest that the interest rate markets also make a strong case for moderating inflation. A significant number of economists and investment strategists got burned throughout 2006 with their repetitive and wrong forecasts of rising intermediate/long-term interest rates.
Tuesday, December 26, 2006

Consensus Review

Ticker Sense recently published a 3-part year-end poll of financial blog writers (including WRA Strategies & Observations) on a variety of investment topics. A couple of area where we think it makes some sense to be contrarian to the consensus:

US Dollar: 62% are bearish. We'd take the contrarian bet on that one and opt for a flat to up dollar.

Gold: only 26% bearish. With inflation likely to surprise on the downside a short gold position seems to make some sense here.

Sector bet: bullish on technology. At best, technology will probably be a middle of the pack performer. The 6-0 bet against consumer discretionary is interesting and causes us to wonder if we should reconsider our negative bet there.

58% of participants believed that Growth will be the better investment style in 2007. We think that even though growth is a slightly cheaper than value currently, that the huge amount private equity cash sloshing through the system will continue to give the performance nod to value.

The most obvious stock pair to bet against is the consensus pick of AAPL over MSFT. Fundamentals would suggest that AAPL could see some multiple compression as growth momentum slows. Microsoft has a number of new product launches in 2007 and a much lower P/E ratio. Regarding GOOG, those predicting $700 are smoking something. The stock will come down to earth in 2007.

More on the equity market, interest rates, the housing market, recession probabilities and some individual equity picks on TickerSense. Check it out.

Saturday, December 23, 2006

Tax-loss Selling

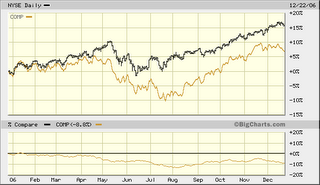
We think it is important to note that the Nasdaq Composite versus NYSE relative strength broke below the early November lows with last week's trading. This has usually been accompanied by weakness in the market as a whole.

Having said that, the week between Christmas and the New Year has usually been a favorable period for stocks - - particularly those stocks that have had difficult years and have been the brunt of tax loss selling by individuals (mutual funds generally sell losers in advance of the end of fiscal years which typically end in October). There are many years when it make sense to buy a basket of stocks during the several days before Christmas that the small investors are throwing away in the small/mid-capitalization segment.

We like to apply some fundamental analysis to these names and come up with a list of companies where various catalysts may occur to augment the returns from a simple bounce off the cessation of tax-loss selling. Stocks are only purchased where a 50% move over the following 3-4 months seems possible based on this combination of fundamentals and bounce capability. Of course, not every name will rise 50%, but a sufficiently large sample will, that in many years it is possible to average 20-25%. Since this has been a relatively solid year for stocks, the strategy of buying the dogs for a bounce doesn't have the same attraction as in other years. Still, this has always been the safest time of year to step up and catch falling knives if there are any that catch your interest.

Thursday, December 21, 2006

Money Supply

Money supply has seen huge jump since early October with adjusted reserves rising at an annual rate of change of 16.1%! This has been a major contributor to the more than 600 points added on to the Dow Industrials. Another major factor has been the private equity cash sloshing around. Anecdotally we hear of many large funds needing to put cash to work. This likely puts a floor on the stock market over the next several months.

Nevertheless, the market is currently overbought and looking somewhat tired. As evidence of the deterioration, the Nasdaq has underperformed the S&P and NYSE indexes since Thanksgiving. In addition, many individual stocks have begun experiencing breakdowns (see SNDK, MOT, GOOG, GLW, BBY, INTU, NDAQ, etc.)

Strategy Update: As evidence of the narrower market, the Select Equity Strategy has seen quarter-to-date lead on the S&P 500 Index narrowed over the past several weeks.

Thursday, December 14, 2006

Housing Bottom?

Today's Wall Street Journal discusses whether or not we have hit bottom in the housing market and how that affects the recession outlook. The article states "the U.S. central bank and much of Wall Street are now betting that the old rules don't apply, and that a recession next year, while possible, is unlikely." However, analysts at UBS Financial produced the chart here (click to enlarge) and ask if "This is what a housing bottom looks like?" They comment, "that if we've learned anything in our decades in this business it is this: it is almost NEVER different this time. . . these charts show that housing prices are still historically out-of-reach while inventories of unsold homes remain historically bloated. The bottom in housing will come when inventories normalize and/or prices become more affordable. The spurs will be: more time, higher incomes, lower rates, further declines in home prices -- or, most likely, some mix of all these. Remember that in the last housing bust in the US (late 1980's), housing peaked in June of 1986 and did not find a bottom until January 1991 . . . Also, the 5+ year boom in the housing market that ended just last summer was, by many measures, "more frothy" than what was experienced in the 1980's . . ."

Wednesday, December 13, 2006

Global Growth

BCA Research comments that the Global Leading Economic indicators are looking up. They say that, "while global industrial production growth is set to slow in the months ahead, these leading indicators imply that downside risks to growth are limited and that a renewed bout of strength is likely in the second-half of 2007."

This makes sense given a lack of significant pull-back in the US economy and a world economy that is increasingly less dependent on the U.S. In a addition, many countries of the world are in much better financial and political shape than they were in the mid/late 1990's. If the world economy grows from here, we would not expect oil to decline much beyond current levels, which is perhaps a contrarian viewpoint these days.

Friday, December 08, 2006

Employment Report

The bond market has priced in a reduction in interest rates but if the employment report does not begin cooperating, don't look for the Fed to accommodate anytime soon. Today's employment report was stronger than expected with a 132k rise in payrolls and previous months revised up, as well. We still expect payrolls to weaken in coming months. The weakness beginning to show up in manufacturing and construction is a harbinger of change in the balance of the economy.

This expected weakness has yet show up in the latest unemployment rate, which reversed only a part of the prior months decline. Yet, UBS says, "The share of consumers perceiving that jobs are hard to get has risen a little in recent months, while the share saying jobs are plentiful has edged down. That pattern is typically associated with a rising unemployment rate."

The employment report smacked bonds with 10-year treasuries rising 7 basis points on the news today and up 15 basis points since the lows of last week.

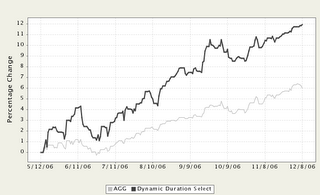
Strategy Update: We recently moved to a defensive posture in the Dynamic Duration Select Strategy, which should benefit the strategy in the event of continued increase in interest rates. The Strategy has seen solid outperformance, nearly doubling the return of the Lehman Aggregate Index (shown here as AGG) since the bottom of the bond market in May.

Thursday, December 07, 2006

Global Equity Markets

Birinyi's Ticker Sense shows a great table of overbought/oversold ranges for global ETFs today. In almost all cases the equity markets are at the high end of the range or within one or two points of the high. We mentioned BCA's concurrent opinion in another post. International markets may go up more over the short-run but we doubt the gains can be held. Book some profits.

Strategy Update: There was a bit too much self-congratulation and back-slapping on the part of dollar bears after the recent weakness. We viewed this development as a contrarian opportunity to remove and partially reverse our short dollar position in the Dynamic FX Strategy. The largest position in the strategy is currently intermediate US treasury securities. Dynamic FX is up over 8.5% YTD and 4% ahead of the benchmark Lehman Aggregate Index (see inset). Past performance is not indicative of future results. For more information on opening a managed account, visit our website. We are an SEC registered investment advisor with more than $40 million in assets under management.

Tuesday, December 05, 2006

Long-term Return Outlook

John Hussman's November 27 review of some of Ben Graham's sayings was interesting from a value methodology point of view. However, we think the chart that was included is particularly relevant to investors who want some guidelines for 20-year returns. Bottom line: the model is predicting 5% per year for the S&P 500 over the next 20 years.

The S&P 500 has returned 84% on a price-only basis since the lows of October 2002; nearly 100% if you count dividends. Good market performance brings out the Ibbotson "buy-and-holders" who say never sell. Ibbotson: "Markets go up over the long-term." (link) Sure, they go up over the long-term, but sometimes it takes 20 years to get back to breakeven after substantial losses. Sometimes, if you happen to live in the wrong country or the wrong century it never happens. In contrast, long-term wealth is created by analyzing where the values reside and investing accordingly.

Strategy Update: since the bottom of the international equity market in June our Focused International Strategy has outperformed the EAFE Index by 10 percentage points through overweights in emerging and asian markets as well as specific country weights in Australia and Brazil. Our manager has elected to move out of some of the asian exposure and create a 20% cash reserve in the Strategy.

Saturday, December 02, 2006

November Performance Recap

Once again, the markets were favorable in November with stocks, bonds and commodities seeing solid gains. A few highlights from our managed Strategies program:

Equity Strategies
Focused Analyst Growth +5.91%; +28.90% 1-year
Select REIT +4.12%; +33.79% 1-year
Equity Opportunity +5.00%; +20.20% 1-year
Focused International Equity +3.50%; +28.46% 1-year

Dynamic Strategies
Dynamic Bond Plus +2.08%; +19.51% 1-year
Dynamic High Yield +0.97%; +18.82% 1-year
Dynamic Fx Plus +1.42%; +11.03% 1-year
Dynamic Commodity +3.41%; +10.72% 1-year
Dynamic Tax-Exempt Plus +1.26%; 11.86% 1-year
Dynamic Beta +0.84%; +11.48% 1-year

Asset Allocation Portfolios
We have eight Asset Allocation Models that combine up to 10 strategies to create a diversified portfolio. The Absolute Return Growth Portfolio has a goal of a consistent 2.5% per quarter and 10% per year. It is currently meeting this goal with a 3-month return of 4.18% and a 1-year return of 10.87%.

The Absolute Return Income Portfolio has a goal of a consistent 2.0% per quarter and 8% per year. It currently far exceeds benchmark with a 3-month return of 4.59% and a 1-year return of 12.61%. Click on the image below for returns for other Strategies and Asset Allocation Portfolios. A pdf file will follow shortly on the website.


Strategies and models are managed by WindRiver Advisors LLC, an SEC registered investment advisor with $40 million in assets under management. Visit our website for more information on investment management and how to establish an account.

Friday, December 01, 2006

Nasdaq Relative Strength Update

In an earlier post we mentioned one of our favorite intermediate-term indicators for the equity market: the relative strength of Nasdaq Composite versus NYSE Composite. As can be seen here, it turned up in August and since then has seen higher highs and higher lows. But now the relative strength has faded for 10 days and is in danger of hitting a lower low, possibly resulting in a sell signal for this indicator.

We also note that individuals usually start hunting for tax losses about this time and continue selling small/mid-cap dogs into Christmas Eve. The last market day before Christmas this year is the 22nd. We've found that if you're thinking of buying small/mid-cap dogs on tax-loss selling the two trading days prior to Christmas generally offer the best prices. This year should be no different.